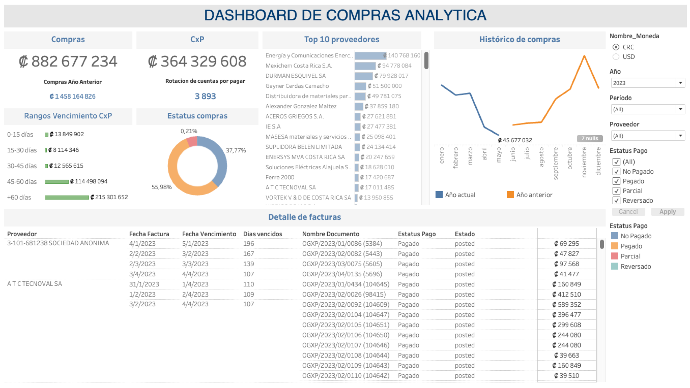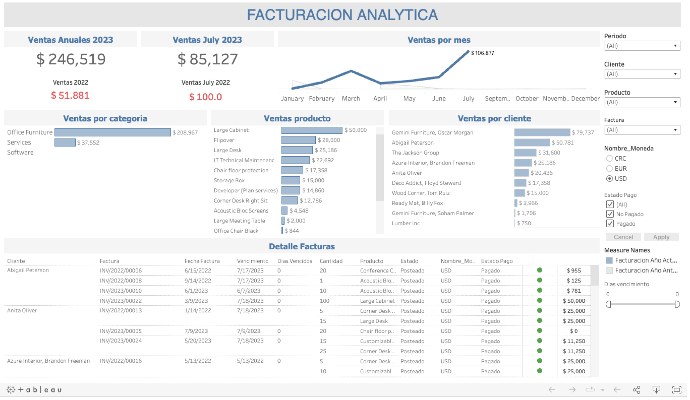
Visual Analytics
Visual Analytics is a discipline that combines data analysis techniques with interactive visualization tools to explore, interpret, and communicate patterns, trends, and relationships in large, complex datasets. The main goal of Visual Analytics is to provide a deeper understanding of the information and enable informed decision-making. Through the graphical representation of data, such as charts, maps, diagrams, and interactive tables, users can intuitively explore the data and uncover hidden information or significant insights that would be difficult to identify with traditional analysis. Visual Analytics is especially useful in business, scientific, and research contexts, where large volumes of data are handled and a quick and effective understanding is required to support strategic decision-making.